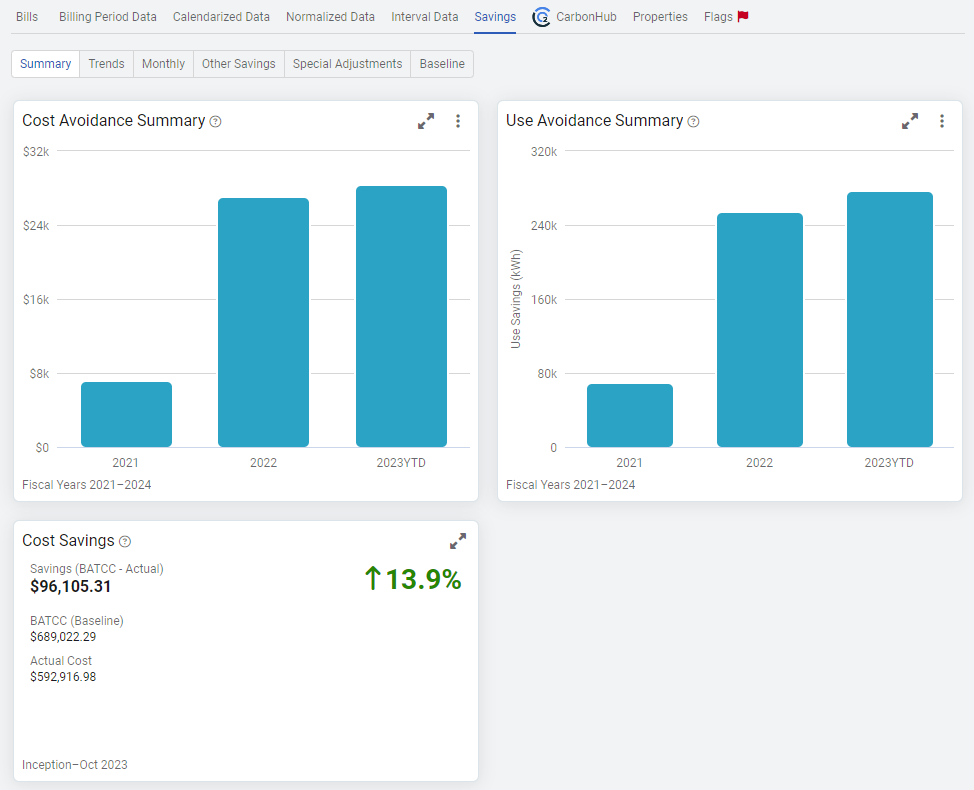
Cost Avoidance
program to date cost savings
The total program cost savings of the selected meter from the program start date to the current month. The 'program start date' is the 'savings start date' for each meter.
The arrow shows the results of your energy management efforts, your savings percentage. A green up arrow indicates positive savings. An orange down arrow indicates a negative savings (a loss). The percentage is the comparison of BATCC to Actual. For example, a value of +25% means today’s actual utility bills would have been 25% higher if you had not implemented energy management measures; hence you have avoided 25%.