Cost Avoidance explanation of savings
Explanation of Savings is the best tool to explain and understand the cost avoidance calculation process.
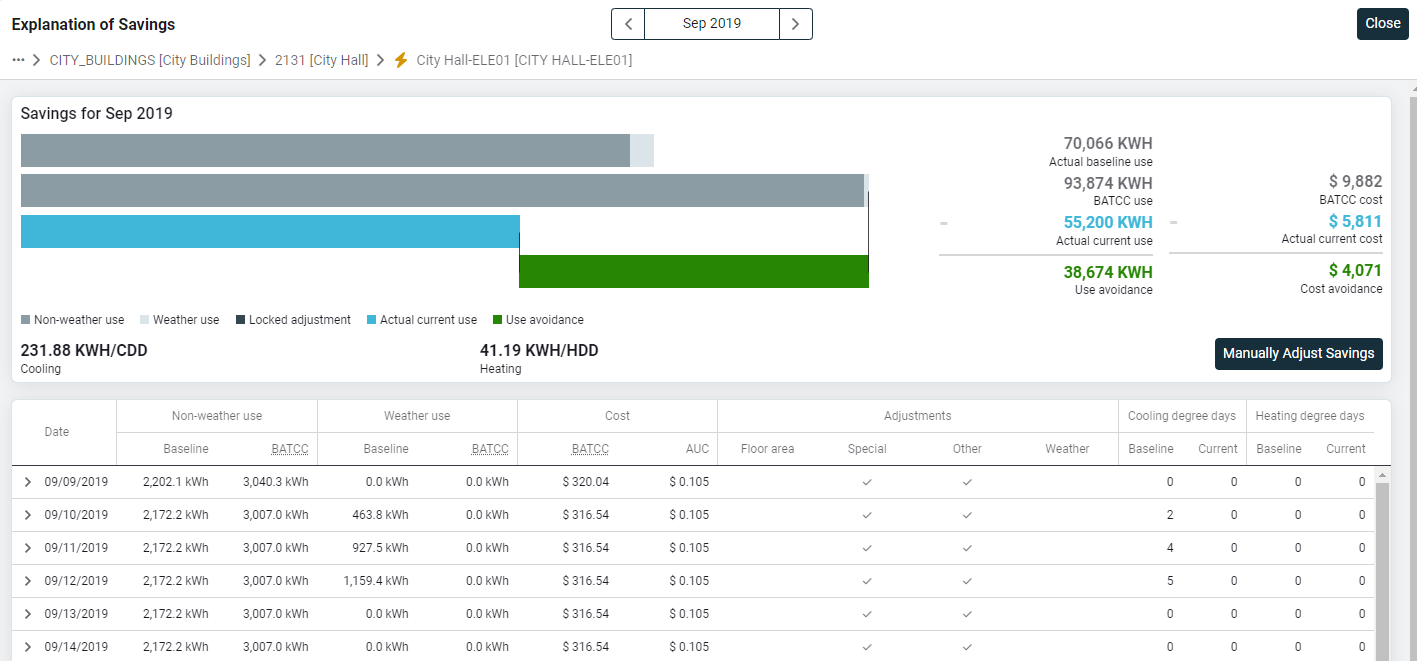
Actual baseline use
The first gray bar represents the actual use on the baseline bill with the actual number listed on the right.
The darker gray on the left is the non-weather sensitive portion of the baseline bill and the lighter gray portion (if it exists) is the weather sensitive portion.
Each baseline bill is split into weather and non-weather portions using the baseline weather model shown in the Baseline tab. Not all bills and meters have a weather sensitive portion.
The lower portion of Explanation of Savings shows the day-by-day baseline weather and non-weather use; the total of the daily values equals the total usage of the first gray bar.
A principle of IPMVP and ISO 50015 is that you do NOT compare the actual current use directly with the actual baseline use. These international guidance documents say that actual baseline use must first be adjusted up or down to current conditions, meaning it is adjusted to today's floor area, weather, occupancy, equipment, etc.
Adjusted use
The second gray bar is the baseline that has been adjusted to current conditions per industry standards, with the actual numbers listed on the right. This is called the BATCC (Baseline Adjusted to Current Conditions).
For example, if the site floor area has increased because the baseline period, the dark gray portion of the BATCC bar is larger, estimating what the usage would have been in the base year had the floor area been larger then too.
Also, if the weather was milder in the current period than in the same period in the baseline, the light gray BATCC portion (if any) is smaller, thereby adjusting the baseline down to a more mild weather condition. This is the case in the illustration above. The winter weather was milder in the current billing period (Jan 2019) and you don’t get use and cost avoidance credit when milder winter weather contributed to energy savings, so the baseline is adjusted to a lesser use amount.
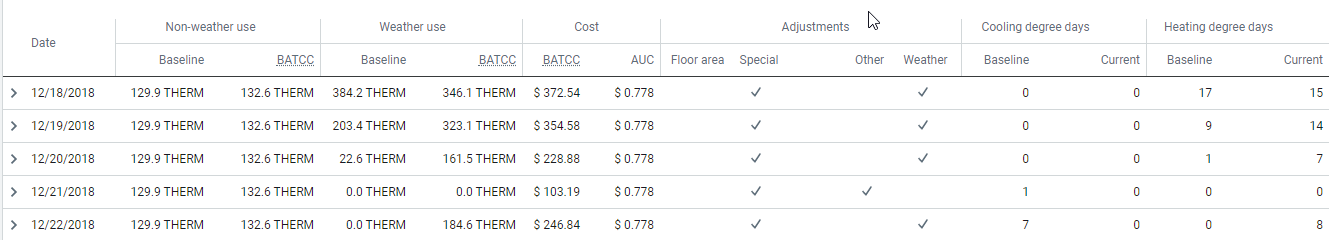
Calculation by day chart
The calculation by day chart shows the day-by-day components.
You can also see the daily degree day values, which indicate if the current weather was milder (lower DD value) or more severe (higher DD value) than the same day in the baseline.
Actual current use
The blue bar represents the actual current use and to the right are the actual use and calculated cost numbers. To calculate the use avoidance, the actual current use is subtracted from the BATTC use.
The positive or negative remainder is the avoided use. The average unit cost of the current bill is used to calculate the avoided cost.
Creating values
- The process starts with the raw baseline bills; the actual bills received during the baseline period. Each bill is broken into weather and non-weather components and distributed across the days in the billing period. The lower table shows the dis-aggregated baseline by day, the same values that are shown on the baseline report CAP06. If you use report CAP06 to add each day in the baseline year, you get the total use of the 12 base year bills (there can be minor variations caused by leap year, overlapping bills, end of year rollover, etc.).
- You may notice that for most bills, the values in the non-weather use column are exactly the same for most days, but a few days are different. This difference is because the billing period dates of the current bill do not align exactly with the billing period dates of the baseline bill. The date list on the left is determined by the current bill, that is, it is the list of days in the current bill (including the start day and excluding the end day).
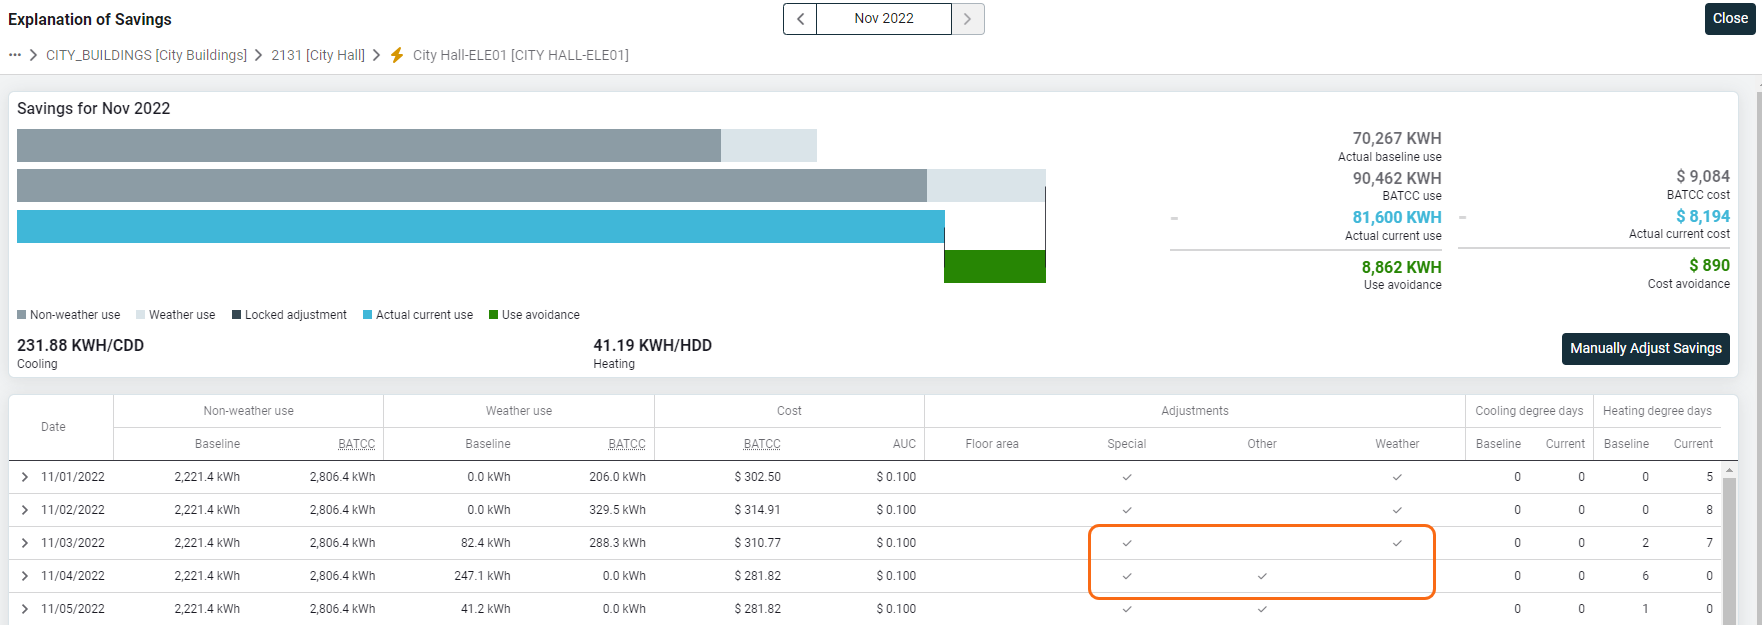
- If a check mark is in the Weather Adjustment column, that indicates a weather adjustment was made for that day, where the adjusted baseline use value is different than the raw baseline use shown on the CAP06 because the raw baseline on the CAP06 has been adjusted to current weather conditions.
- If a check mark is in the Floor Area Adjustment column, the non-weather and weather use values have been floor area prorated for that day.
- If a check mark is in the Special Adjustment column, the use has been adjusted by a special adjustment that you created.
- The Other Adjustment column indicates other processor notes and conditions.
Click a day row to open and view the adjustment details.
The daily AUC shows the current average unit cost for that day. It is applied to the sum of the non-weather and weather use to calculate BATCC daily cost.
Manual adjustment
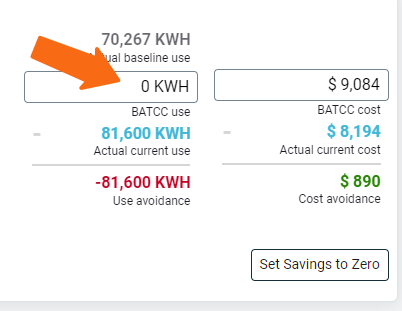
You may have a need to manually adjust the use and cost avoidance values for a particular month because of an abnormal, non-routine situation affecting this meter for this month. The most common need is to zero-out the savings for a month, which means this month appears on reports as a no-loss, no-gain month. The most typical reason is a full or partial building shut down because of a construction project or building emergency (closure caused by fire, weather damage, HVAC failure, etc). Click Set Savings to Zero and then enter a reason in the change log.
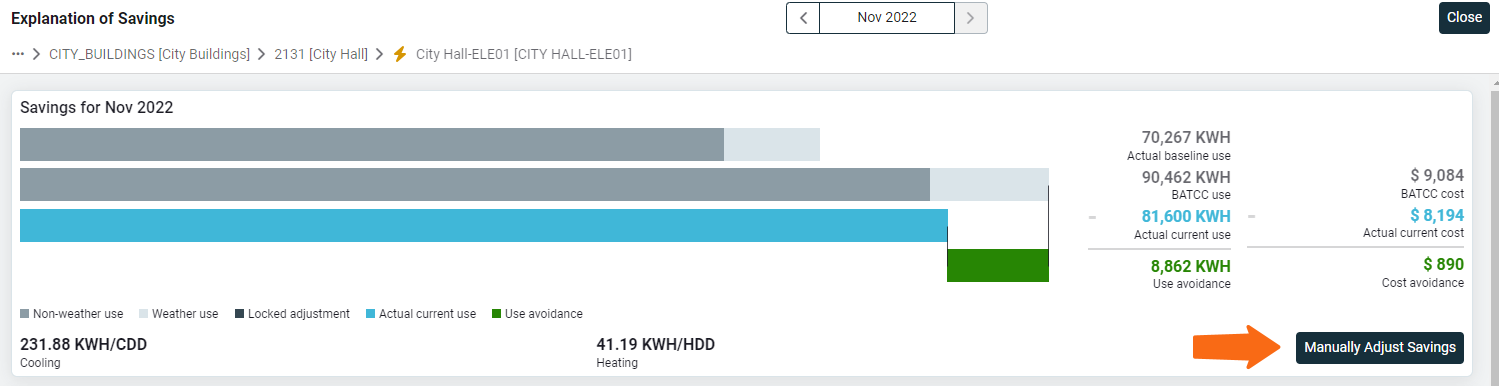
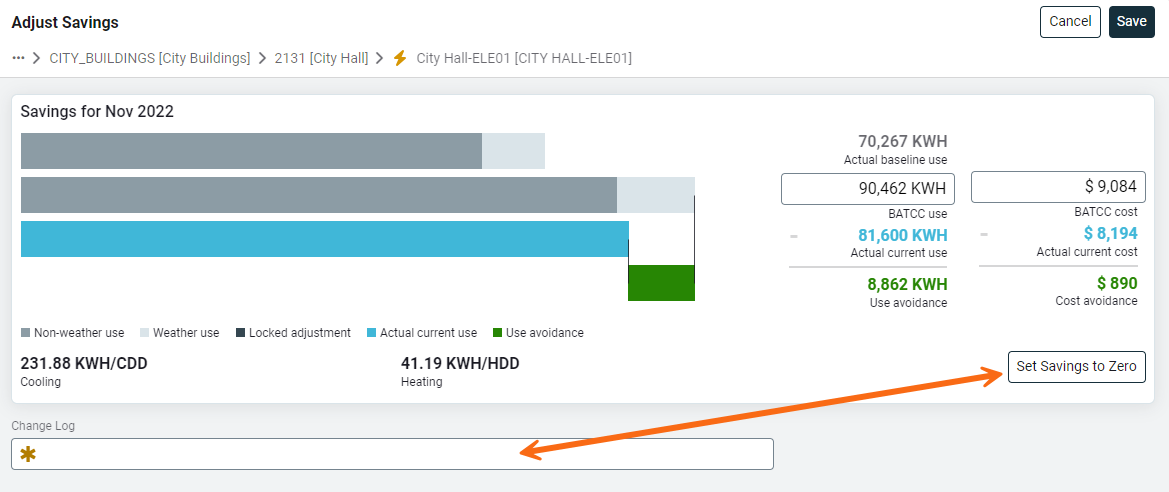
You can also manually enter BATCC use and BATCC cost values which directly control the resultant use avoidance and cost avoidance values. Be sure to document your reason and calculation methodology in the change log. Manually adjusted months are never re-processed unless you manually re-enter your information and re-process this meter for this month.
Problem comparing years
I ran a report to see how the total Cost Avoidance for this month compared to other months of March. The Cost Avoidance isn't what I was expecting when comparing to previous years.
Answer - For Cost Avoidance calculations, the only years that matter are the current year and the baseline year. You can see all the factors and adjustments for each specific month on the on the Savings tab of the meter and expanding the month in the chart.